
 MSG3 Globe 24 hrs incremental loop (past 96 repeat cycles)
Welcome to
Lutz Lesch
Synoptic and Satellite Meteorology
[Message of the day]
- en savoir plus -


^ goclick images s.v.p. ^
METEOSAT MSG-1/2/3 (Meteosat-8/9/10)
HRIT channels VIS006, VIS008 and IR_016 (18:00 UTC, 12:00 UTC and 06:00 UTC),
spatial resolution 3 km
subsatellite
METEOSAT MSG3 past 7 days monitor,
12 UTC
METEOSAT MSG3 past 7 days monitor,
06/12/18 UTC

^ goclick image s.v.p. ^
METEOSAT MSG-1/2/3 (Meteosat-8/9/10)
HRIT channel HRV (00:00 UTC, 06:00 UTC, 12:00 UTC or 18:00 UTC),
spatial resolution 1 km
subsatellite
 HRIT update service
MSG-1/2 Normalized Difference Vegetation Index NDVI
computed MSG-1/2 NDVI
HRIT (CH2/CH3) (under construction)
and
LRIT (CH1/CH3)
{composit
of past 14 days}


 HRIT update sevice
Image or Weather Situation of the Month
July 2007


^ goclick images s.v.p. ^
Cirrus patterns visualize and superimpose
heavy upper level horizontal ageostrophic air motion v[h,a] (300 hPa)
in close vicinity to Polarfront Jet Core (PFJ) axis and Delta
(cross circulation southwestwards, normal and upstream accelerating)
03 July 2007, 12:00 UTC
L. Lesch
AVHRR NOAA-17 (left) and AVHRR NOAA-18 (right)
Channels 1, 2 and 4 (VIS, NIR and IR)
at Berlin 12:00 UTC
Free University of Berlin
Institute of Meteorology
 Tempête Kyrill
18 Jan 2007 see server sat03
 History of Image of the Month
and
additional Special Issue
NOAA AVHRR EUROPE (FU-Berlin)

Last update (N17/18/19 Berlin daylight orbits, N17/18/19 Berlin nightlight orbits):


 Past 7 days update service template
NOAA 17/18/19 AVHRR Berlin daylight orbits (1km)
NOAA 17/18/19 AVHRR Berlin nightlight orbits (1 km)
Synoptic clipboard (operational):
Polar Front Jetstream (PFJ) and connected dynamic vergences:
global center
of maximum tropospheric kinetic energy (power station),
initiator and controller
of atmospheric and local surface weather in all levels and scales
.
DWD Europe Model (GME-EM) and LOCAL Model (LM) Domain (red)
FU-Berlin NOAA 1km and 4km (dashed) domain (blue)
FU-Berlin METEOSAT-[5-7] 4km domain (black)

DWD and FU-Berlin NOAA / Meteosat grid domains
2D-Analysis at 11 (vertical) pressure levels
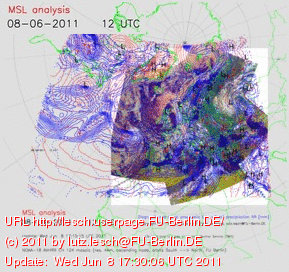
and superimposed NOAA-19 (left), NOAA-18 (right) AVHRR Satellite Mosaics EUROPE
Surface pressure (MSL) / 1000 / 900 / 850 / 800 / 700 / 600 / 500 /400 / 300 / 200 hPa Analysis
at 00 UTC / 12 UTC (HHH, TT and FF; RR, v(z), Divergence and Vorticity v(h))
FU-Berlin NOAA 1km and 4km Domain:
DWD GME-EM (EUROPE Model) grid data analysis
of past 7 days:
Last update:
 NOAA-19, MSL, 12 UTC
 NOAA-19, 300 hPa, 12 UTC,


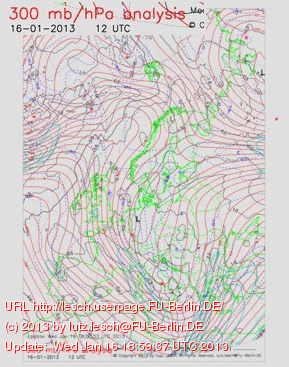


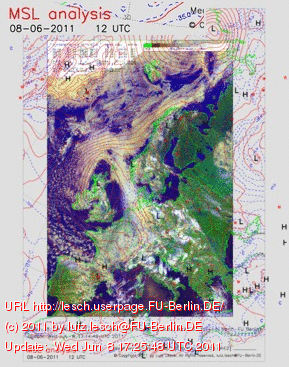

 Analysis service
 overview SAT_NET see server sat03
Computed diagnostic and quasi prognostic Precipitation
Europe and North Atlantic (00 UTC and 12 UTC)
DWD GME-EM Domain grid data (EUROPE Model) with
superimposed NOAA-17, NOAA-19 and NOAA-18 AVHRR mosaic, spatial resolution 1 km and 4 km,
(channel 3 [WV, 00 UTC]; channels 1, 2 and 4 [12 UTC])
for past 7 days:
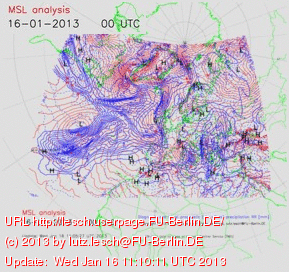
2D Analysis Mean Sea Level MSL:
Last update:
 NOAA-19, MSL, 12 UTC
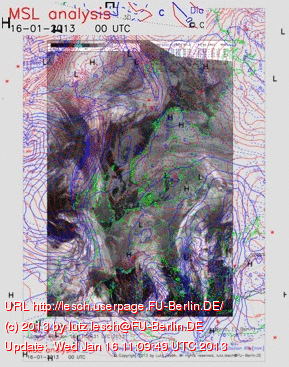
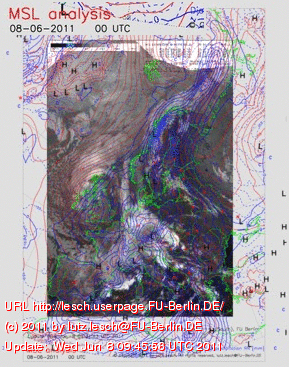
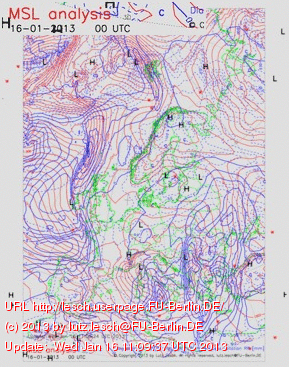
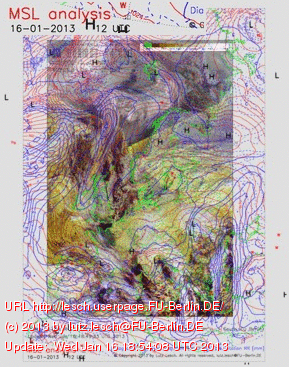


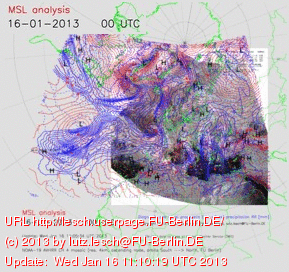
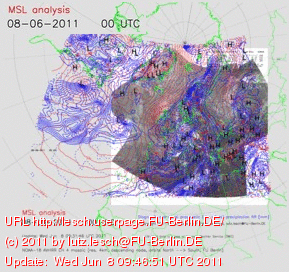


 Analysis service
2D-Analysis of computed Divergence / Convergence and rel. Vorticity [v(h)]
at level 1000 hPa and 300 hPa
Europe and North Atlantic (00 UTC and 12 UTC)
FU-Berlin NOAA 1km and 4km Domain:
DWD GME-EM Domain grid data (EUROPE Model) with
superimposed NOAA-19 and NOAA-18 AVHRR mosaic, spatial resolution 4 km,
(channels 1, 2 and 4 [12 UTC])
for past 7 days:
Last update:


 Analysis service
Sea/Land Surface Temperature Analysis 00/12 UTC (SST/LST)
DWD GME-EM Domain grid data (EUROPE Model) with
superimposed NOAA-17 AVHRR mosaic (channel 4 [IR], spatial resolution 4 km)
and nested Barents Sea Domain
at 00 UTC for past 7 days:
Last update:


 Analysis
Detection of SNOW and ICE
(METEOSAT MSG and NOAA-16/17 AVHRR):


^ goclick images s.v.p. ^
 MSG2 Globe 24 hrs incremental loop (past 96 repeat cycles)
 Analysis METEOSAT MSG1
 METEOSAT MSG2 past 7 days monitor
12 UTC
Multispectral AVHRR NOAA-16 mosaic EUROPE,
(VIS,NIR,WV; satellite orbits from South to North passing Berlin area of reception),
spatial resolution 4km subsatellite
Multispectral AVHRR NOAA-17 mosaic EUROPE,
(VIS,NIR,WV; satellite orbits from North to South passing Berlin area of reception),
spatial resolution 4km subsatellite
 Analysis NOAA/AVHRR
DWD GME-EM grid EUROPE
analysis and animations (5 dimensions)
superimposed with METEOSAT MSG and NOAA satellite informations
incremental update every 12 hours (00 and 12 UTC)
of past 30 days
 < goclick image s.v.p.
Polar-/ Subtropic Front Jetstream (PFJ/SFJ) animation
from 4 January 2006 00 UTC
to
2 February 2006 12 UTC (60 slots)
 Analysis see server sat03
 Links and further pages under "re"construction!


 Reconstruction
Retrospectives and additional server links:
 go
go

... since kernel 0.96
Creation Date: April 8th, 1996
Last Modification: 2 February 2006
Lutz Lesch
Established and maintained by lutz.lesch@FU-Berlin.DE
Contact: Lutz Lesch
e-mail:
lutz.lesch@FU-Berlin.DE
lutz.lesch@sunrise.ch
![]()
![]() Tempête Kyrill
18 Jan 2007 see server sat03
Tempête Kyrill
18 Jan 2007 see server sat03
![]() History of Image of the Month
and
additional Special Issue
History of Image of the Month
and
additional Special Issue
![]()
![]()
![]() Past 7 days update service template
Past 7 days update service template

![]() NOAA-19, MSL, 12 UTC
NOAA-19, MSL, 12 UTC![]() NOAA-19, 300 hPa, 12 UTC,
NOAA-19, 300 hPa, 12 UTC,![]()
![]()
![]()
![]()
![]()
![]()
![]()
![]()
![]() overview SAT_NET see server sat03
overview SAT_NET see server sat03![]()
![]()
![]()
![]()
![]()
![]()
![]()
![]()
![]()
![]()
![]()
![]()
![]() MSG2 Globe 24 hrs incremental loop (past 96 repeat cycles)
MSG2 Globe 24 hrs incremental loop (past 96 repeat cycles)
![]() Analysis METEOSAT MSG1
Analysis METEOSAT MSG1![]() METEOSAT MSG2 past 7 days monitor
12 UTC
METEOSAT MSG2 past 7 days monitor
12 UTC![]() Analysis see server sat03
Analysis see server sat03